

The Spotlight
Summary of Today’s Article: Sonoma County hotels posted year-over-year occupancy gains in every month of 2026 through June, extending a recovery driven by fuller rooms rather than higher prices. Occupancy rose 7% year to date, while average daily rates increased just 1.7%, lifting revenue per available room 8.9%. June was the strongest month of the year, with occupancy reaching 73.6% and revenue per available room up 14.3%. The central question now is whether Sonoma can convert stronger demand into sustained pricing power.

Six Months Up on Volume, Six Months Flat on Rate
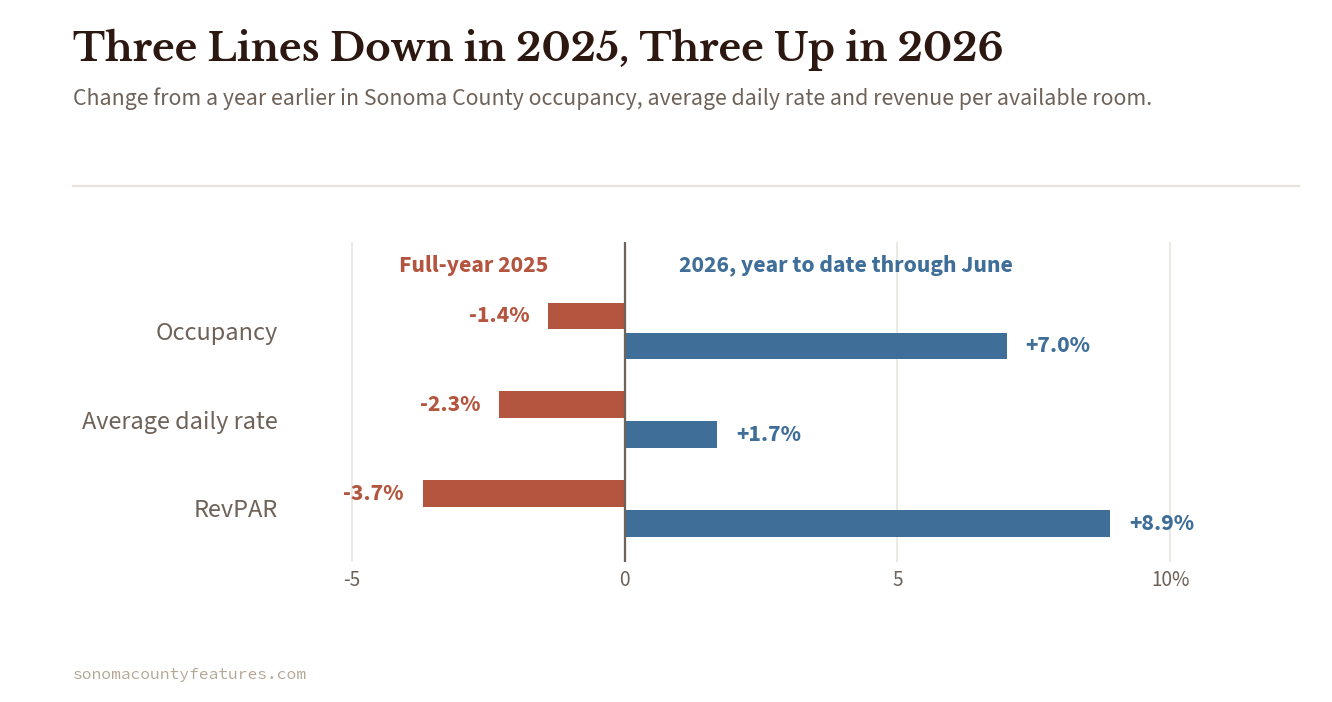
Through June, Sonoma County occupancy reached 61.8%, up 7% from the same period in 2025. Average daily rate reached $207.51, up 1.7%. Revenue per available room reached $128.17, up 8.9%.
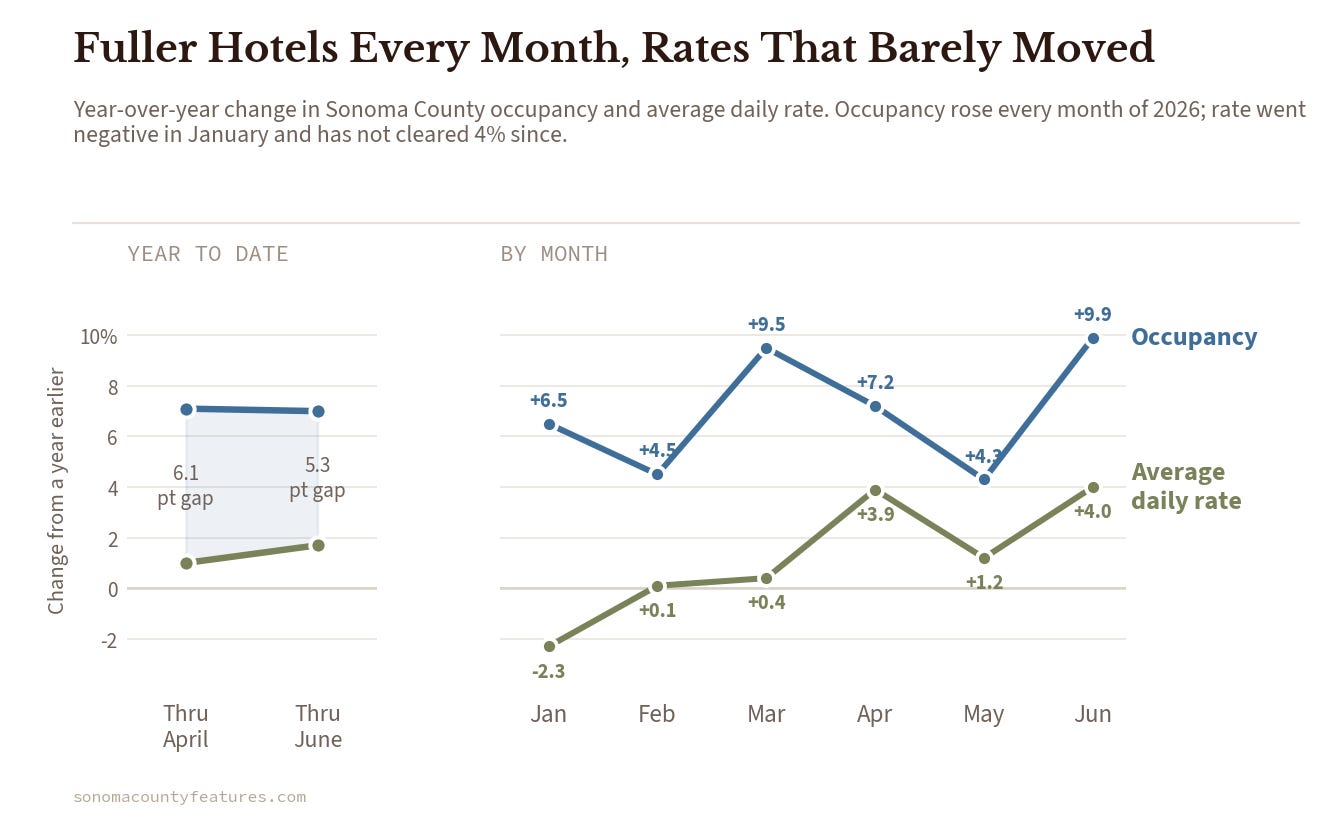
Month by month, one line is emphatic and the other is grudging. Occupancy rose year over year in all six months: 6.5% in January, 4.5% in February, 9.5% in March, 7.2% in April, 4.3% in May and 9.9% in June. Average daily rate opened the year down 2.3%, crossed into positive territory in February at 0.1% and has stayed there without ever clearing 4%: 0.4% in March, 3.9% in April, 1.2% in May and 4% in June.
Six months of fuller hotels. Six months of rates that have barely moved. The wedge between the two year-to-date lines has narrowed — from 6.1 percentage points in the April reading to 5.3 in June — but it has narrowed by a fraction of a point, not by half.
May Ran the Mirror Image of Napa
The two counties diverged most sharply in May, and they diverged in opposite directions on both measures.
Sonoma’s May occupancy rose 4.3% while its average daily rate rose 1.2%. Napa’s May occupancy fell 4.4% while its rate rose 5.1%, to $546.25. Same month, opposite trades: Sonoma took the guests, Napa took the price.
May was also Sonoma’s high-water mark on rate so far this year. Its average daily rate of $246.02 that month came in above June’s $241.57 — a reminder that the rate line is not climbing steadily so much as moving with the calendar.
Half of Napa’s Rate, a Larger Share of Its Rooms
The June competitive set puts the county’s position plainly.
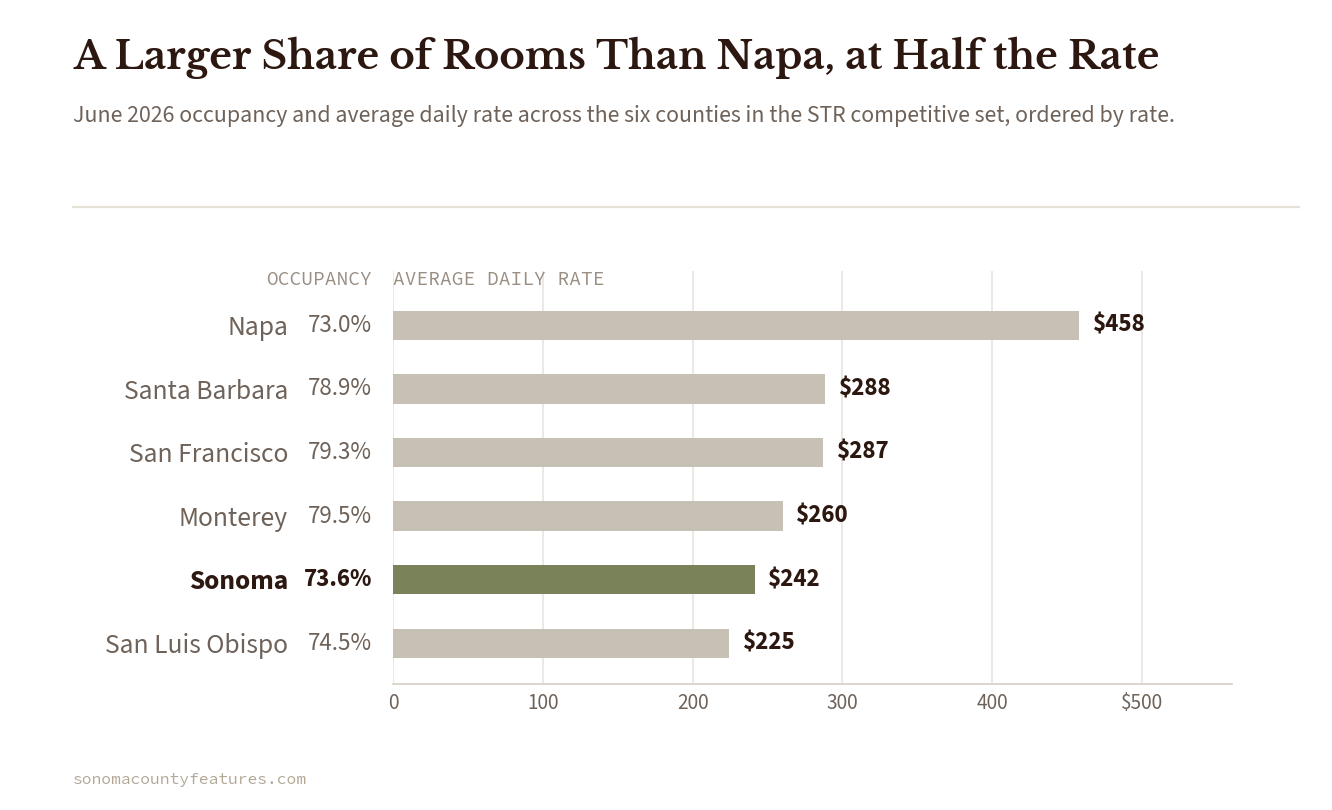
Sonoma ran 73.6% occupancy in June, ahead of Napa County’s 73% and behind the other four counties in the set — Monterey at 79.5%, San Francisco at 79.3%, Santa Barbara at 78.9% and San Luis Obispo at 74.5%. Sonoma’s average daily rate was $241.57. Napa’s was $457.93, roughly 90% higher in the same month at a slightly lower occupancy. Sonoma’s June revenue per available room of $177.87 was up 14.3%, its strongest month of the year.
The year-to-date comparison is closer and less flattering. Napa’s occupancy through June was 62.4% against Sonoma’s 61.8%, and Napa’s rate rose 3.1% against Sonoma’s 1.7%. Sonoma is still growing occupancy far faster — 7% against Napa’s 0.8% — but the county that already charges nearly twice as much is now the one raising it more quickly.
The Year That Turned Over
Measured against 2025, the shift is unambiguous. Sonoma County closed last year with occupancy down 1.4%, average daily rate down 2.3% and revenue per available room down 3.7%. All three lines are positive halfway through 2026, and the one carrying the others is occupancy.
Bottom Line
Sonoma County has spent six months proving it can fill rooms again. It has not yet proved it can price them. The rate line has been positive since February and has cleared 4% exactly once. The higher-demand months are now inside the data, June was the strongest month of the year on every measure and rate is still the number that has not caught up.
—
Tim Carl is a Northern California-based photojournalist.
The Economy
Unemployment: Sonoma County’s unemployment rate was 4.2% in June, up from a revised 3.7% in May and below the year‑ago estimate of 4.5%. EDD labor release
Civilian labor force: Sonoma County’s civilian labor force was 244,709 in May, down marginally from 244,915 in April and from around 245,200 a year earlier. FRED labor force series
Total nonfarm jobs: Total nonfarm employment in Sonoma County was about 206,400 in May, little changed month‑to‑month and up modestly from May 2025, according to the latest county release. EDD labor release
Private education and health services: Employment in private education and health services remained near 41,500 in May, up roughly 1,200 from a year earlier, based on recent FRED sector data trends. FRED private education
Leisure and hospitality: Leisure and hospitality employment was roughly 26,800 in May, an increase of about 700 from May 2025. FRED leisure
Retail trade: Retail trade employment stood near 22,300 in May, up around 400 from May 2025 on the latest seasonally adjusted series. FRED retail trade
Home values: The average Sonoma County home value was about $799,000 as of Zillow’s most recent update (data through mid‑2026), down 1.5% from a year earlier, with homes going pending in around 16 days. Zillow county housing
Type‑02 winery licenses: Sonoma County had 1,313 Type‑02 winery licenses as of early July, down 27 from 1,340 in May, based on the latest ABC ad hoc licensing report. ABC ad hoc report
Explore These Related Articles:


Browse All Sonoma County Features Stories
Browse All Napa Valley Features Stories
Browse All Lake County Features Stories
—
The views, opinions and data presented in this article are those of the author and do not necessarily reflect the official policy, position or perspective of Sonoma County Features or its editorial team. Any content provided by our authors is their own and is not intended to malign any group, organization, company or individual.